If this manual didn’t resolve your technical questions, you found bugs, or you have feature requests or suggestions, please contact our Support team . Please include the following:
- Steps to reproduce your problem
- A description of the expected behavior and the actual behavior
- A code snippet
- A screenshot
- A relevant extract from the log file
- The exact error message if there is one
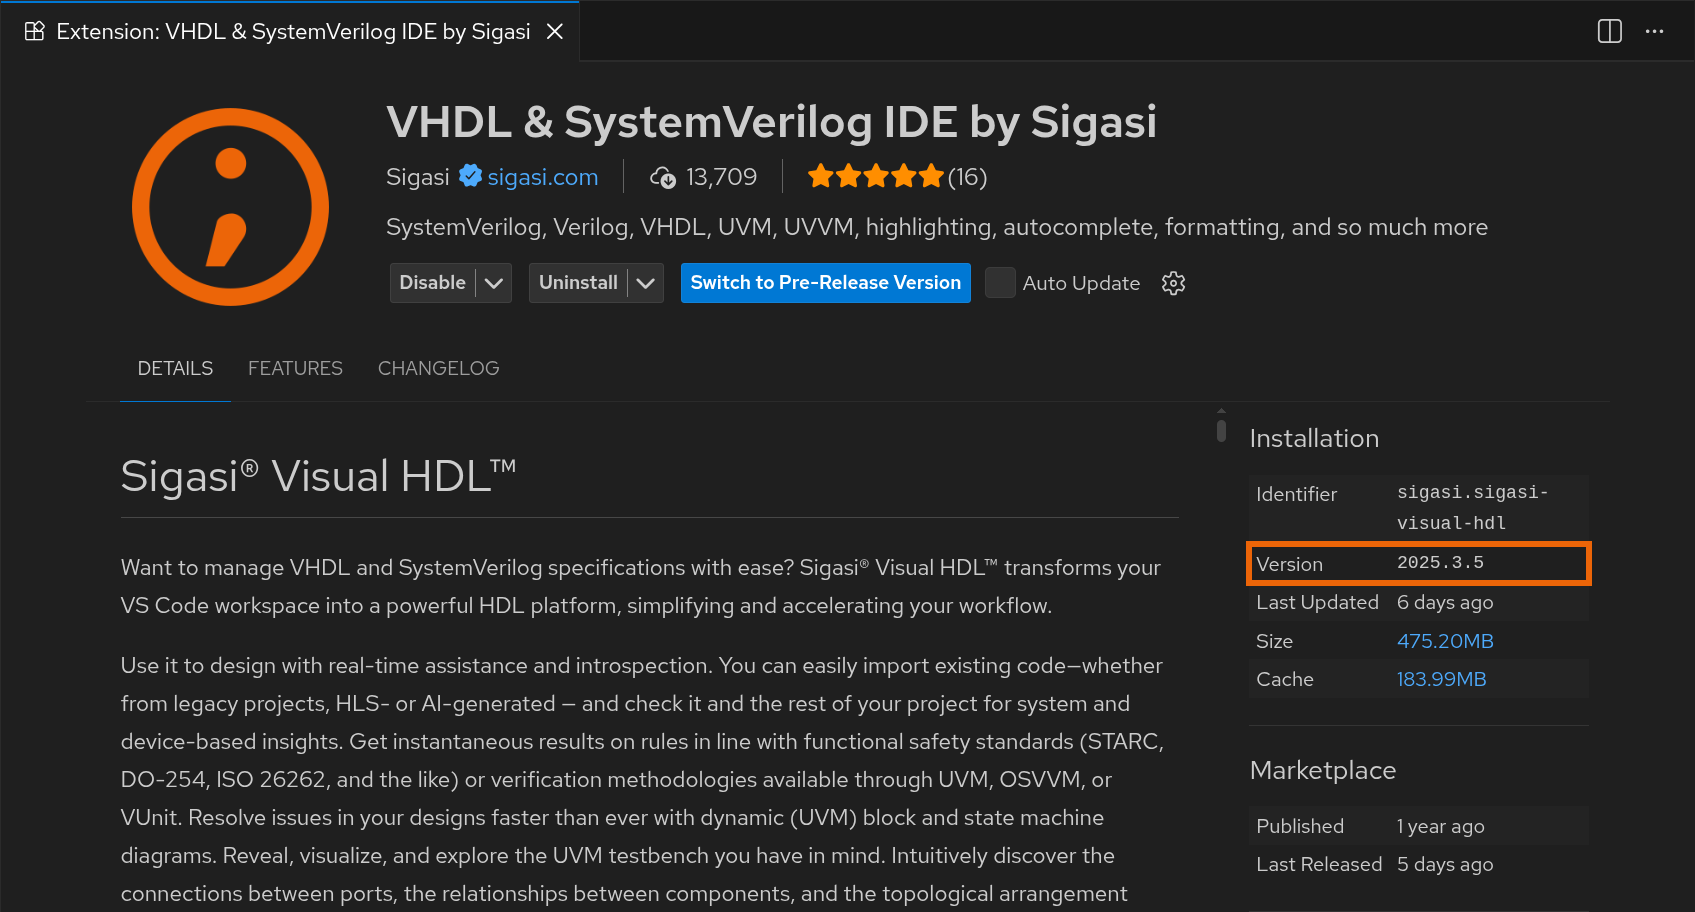
- The version number of your Sigasi product from the right column of the extension page
- For performance or memory problems, a support bundle
For any billing-related questions or administrative questions, such as changing your number of licenses, contact our Sales team .
Reloading
If anything is not behaving as you’d expect it to, it’s a good idea to try reloading VS Code through the Developer: Reload Window command. If the issue persists, is reproducible, or occurs often, please contact our Support team .
License
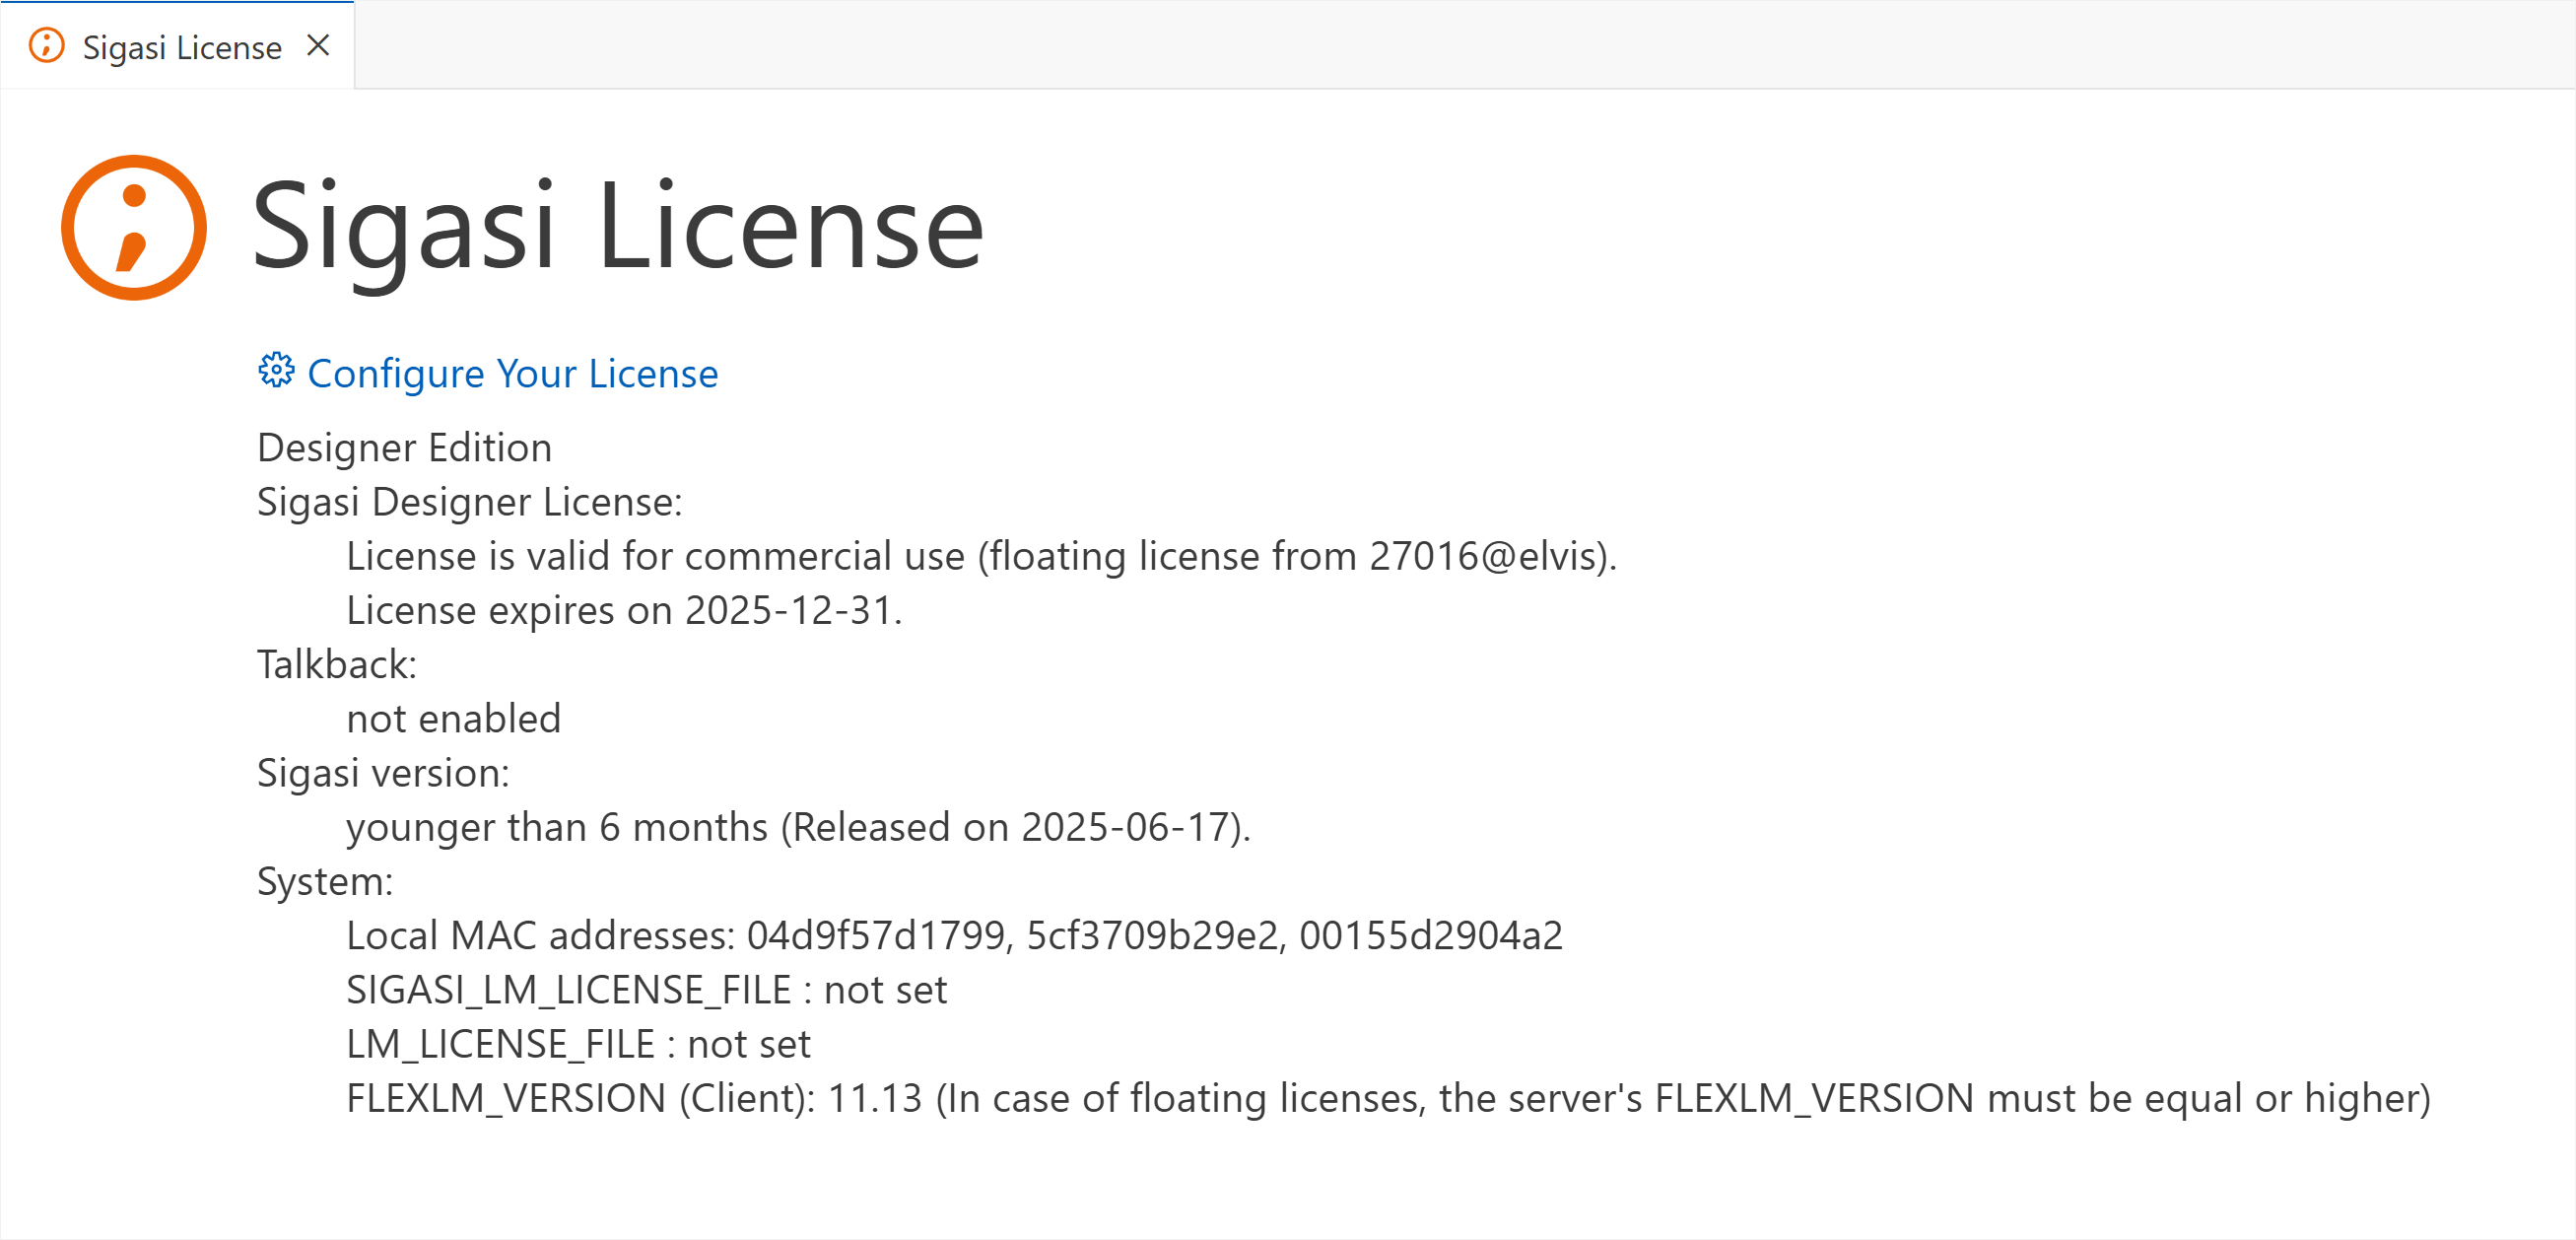
If you’re not getting the right type of license, you can open the license diagnostic page. It can be opened by clicking on the license status bar item at the bottom of your window.
Gathering information
Having contacted our Support team for a bug, they might ask for more information. You can get this information as shown below.
Version
You can find the version on our extension page. Go to the page by opening the Extensions Activity and searching for VHDL & SystemVerilog IDE by Sigasi .
Logs
Sigasi logs contain filenames from your project. Only send them to us if you’re allowed to or after sanitizing them.
Before getting logs, it’s best to increase the log severity. Open the Settings (
Ctrl+,
) and search for sigasi.server.log.level
. Select debug. Every level up from the lowest option (all) logs more than the previous one. To find the logs, open the Command Palette (
Ctrl+Shift+P
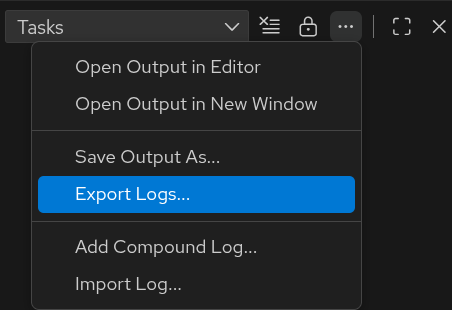
) and run the Sigasi: Open Log command. This opens the Output view in the panel. These contain the logs produced by our extensions. You can simply copy the text in this panel or click the and select Export Logs....
To deeply understand the interactions leading up to your problem, the Tracing Log is crucial. First, set the sigasi.trace.server
setting to verbose. Then reproduce your issue and run the Sigasi: Open Tracing Log command. This again opens the Output view in the panel. This log contains all the interactions between our Language Client and Language Server.
You can also find these logs on your filesystem.
- On Linux, the logs are below
~/.config/Code/logs - On Windows, the logs are in
%AppData%\Code\logs
In those folders, find the [datetime]/window[1]/exthost/output_logging_[datetime]/[0-9]-Sigasi{Tracing}.log files.
We recommend opening the exthost folder using the Developer: Open Extension Logs Folder command.
For each occurrence of [datetime], choose the most recent directory available. Please send us both the debug log and the tracing log.
If you need to enable fine-grained logging to help us debug a very specific issue, refer to the Fine grained logging article.
A support bundle collects these log files for you automatically, together with other diagnostic information. See Troubleshooting reports below.
VS Code logs
In rare cases, or when the extension doesn’t even start, you’ll need to look at the VS Code logs. Open them by typing view Output in the Quick Open menu (
Ctrl+P
). Press the icon and select Export logs.
Troubleshooting reports
When Sigasi is slow, freezes, or runs out of memory, a set of Sigasi: … commands let you capture what the language server was doing, so our Support team has something to look at beyond the log. Every command writes its output to a file on your machine. Nothing is sent to Sigasi until you decide to share it. This is separate from Talkback and telemetry, which only ever transmit metadata if you agreed to that, but never HDL code.
Turning them on
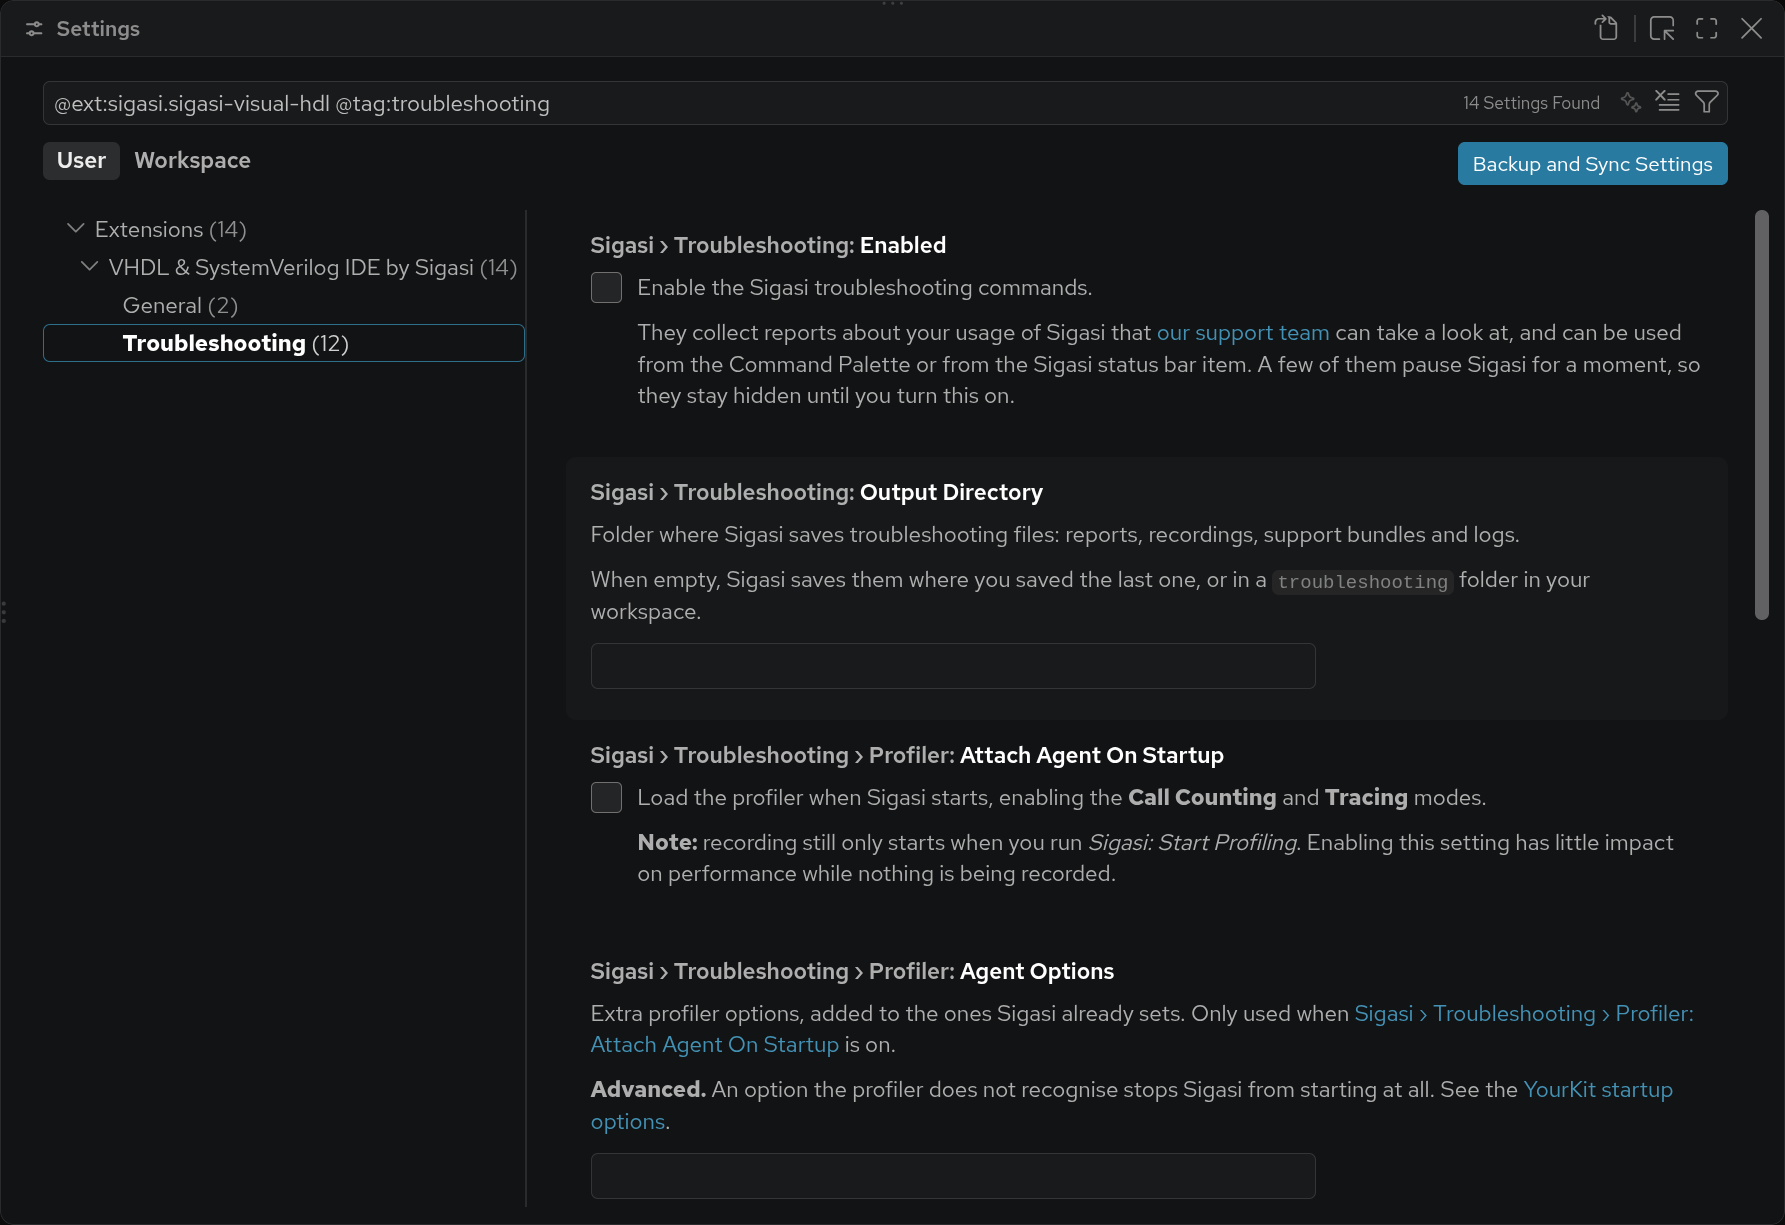
Several of these commands pause the language server for a moment—a class histogram forces a full garbage collection, a heap dump writes the whole heap—so they stay hidden until you turn on the sigasi.troubleshooting.enabled
setting.
Everything they produce is saved under sigasi.troubleshooting.outputDirectory
, which defaults to a troubleshooting folder in your workspace and otherwise remembers the folder you picked previously.
Where to find them
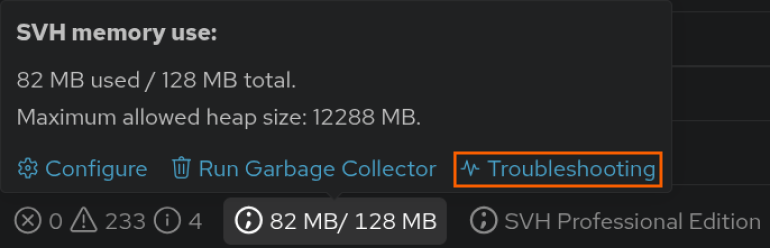
Open the Command Palette ( Ctrl+Shift+P ) and search for a command by its title, in the category Sigasi.
They are also grouped in the hover of the memory status bar item, next to the memory figures: Reports, Recordings, and Files for support. A marker appears on the status bar item itself while a recording, profiling session, or performance log is running, since those slow down Sigasi until you stop them. See monitoring memory use for more on that status bar item.
Reports
These commands answer a question on the spot by opening their result in an editor and leaving no files behind.
- Capture Thread Dump - what every thread is doing right now. Since this is a snapshot of one moment, taking a few of these some seconds apart can show how things evolve, which is useful when Sigasi appears to hang.
- Capture Class Histogram - what is on the heap, by class. A good first step when you suspect a memory problem, since it costs less than a full heap dump.
- Show JVM Information - JVM flags, launch arguments, native memory use, and recording state, all in one report.
Recordings
These commands come in start/stop pairs: start one, reproduce the problem, then stop it to save the recorded information to a file.
- Start / Stop Flight Recording - records what Sigasi is doing over time; stopping writes a
.jfrfile. - Start / Stop Profiling - YourKit CPU profiling. Choose the mode (
Sampling,Async Sampling, orCall CountingandTracingif the profiler was connected at startup) and whether to record allocations. Stopping saves a.snapshotfile. - Start / Stop Performance Logging - a PerfMark trace of Sigasi’s own instrumented operations, written when you stop logging.
Capture heap dump
This writes a full .hprof heap dump: a snapshot of everything currently in memory, saved to a file of your choosing. Request this when memory use is high, or when Sigasi appears to hang because the garbage collector is struggling to keep up.
A heap dump contains the text of every HDL file currently loaded, along with identifiers, comments, and file and library paths. Treat it like sending the project itself. See what you can share below before sending one anywhere.
Collect support bundle
This is usually the best first response to a support request: it gathers a thread dump, a class histogram, JVM flags, the command line, a native memory summary, whether Flight Recorder is running, and your Sigasi log files, all into one folder. If one of these fails to capture, its reason is written into its own file instead of aborting the rest, so a broken installation still yields a usable bundle. It does not include a heap dump or any recordings. Before sending the support bundle to anyone, do consult what you can share first.
Startup settings
This Troubleshooting settings category covers the things that only take effect when Sigasi starts. Each of these will ask for a window reload to take effect.
What can you share?
The regular log files are usually fine to share with Sigasi as a baseline, but they can contain file and directory names from your project, so check whether that’s allowed at your organization before sending them. The table below rates each report against that same baseline, so you know what you’re agreeing to when you send one along.
| Report | What’s in it | Compared to the log files |
|---|---|---|
| Thread dump | Thread names and Java stack traces. A thread name can mention the file or library Sigasi was working on. | About the same |
| Class histogram | Java class names with instance counts and sizes. No project data at all. | Less |
| JVM information | JVM flags, the full launch command line, native memory figures, and recording state - including installation, workspace, and cache paths, and any custom JVM arguments you’ve set. | About the same |
| Performance log | Names and timings of Sigasi’s own instrumented operations. A task name can mention the file being analyzed. | About the same |
Flight recording (.jfr) | Thread activity, stack traces, allocation samples, GC and lock events, plus file and socket I/O events naming the files and hosts touched, the JVM command line, system properties, and environment variables. Not the contents of your files. | More. Worth a look before sending, since environment variables can hold internal host names or credentials |
Profiler snapshot (.snapshot) | Method-level CPU data, and, with allocation recording on, the allocated types and their stack traces, plus the JVM’s system properties and command line. No HDL text. | More |
Heap dump (.hprof) | The text of every HDL file currently loaded, identifiers, comments, file and library paths, project settings, and environment. | Far more - treat it like sending the project itself |
| Support bundle | The thread dump, class histogram, JVM flags, command line, native memory summary, whether Flight Recorder is running, and your Sigasi log files. Nothing else. | About the same, by construction |
A few things follow from that:
- Collect Support Bundle is usually all our Support team needs, and it’s no more sensitive than the logs.
- Don’t reach for a heap dump by default. Capture Class Histogram and Show JVM Information answer some memory questions already and carry no design data.
- If a heap dump really is necessary—say the class histogram and JVM information didn’t explain what’s using the memory—see whether you can reproduce the problem on a reduced or anonymized copy of your project and dump that instead. Heap dumps are also large. They have roughly the size of the memory in use, so easily several gigabytes.
- If you do end up needing to send the real thing, get it cleared internally first, then ask our Support team how best to send it.
Everything stays on your machine until you send it. You can inspect a heap dump or a Flight Recording yourself first, with tools like JDK Mission Control or Eclipse MAT .